
NBA Strength of Schedule: Opponents, Rest and Travel
How NBA strength of schedule is built from opponent ratings, rest and travel, and why Tankathon's win-percentage figure and points-based SOS disagree.
Posted by Gamble-24 Slate Desk on . Kick-off to full time in 5 min.
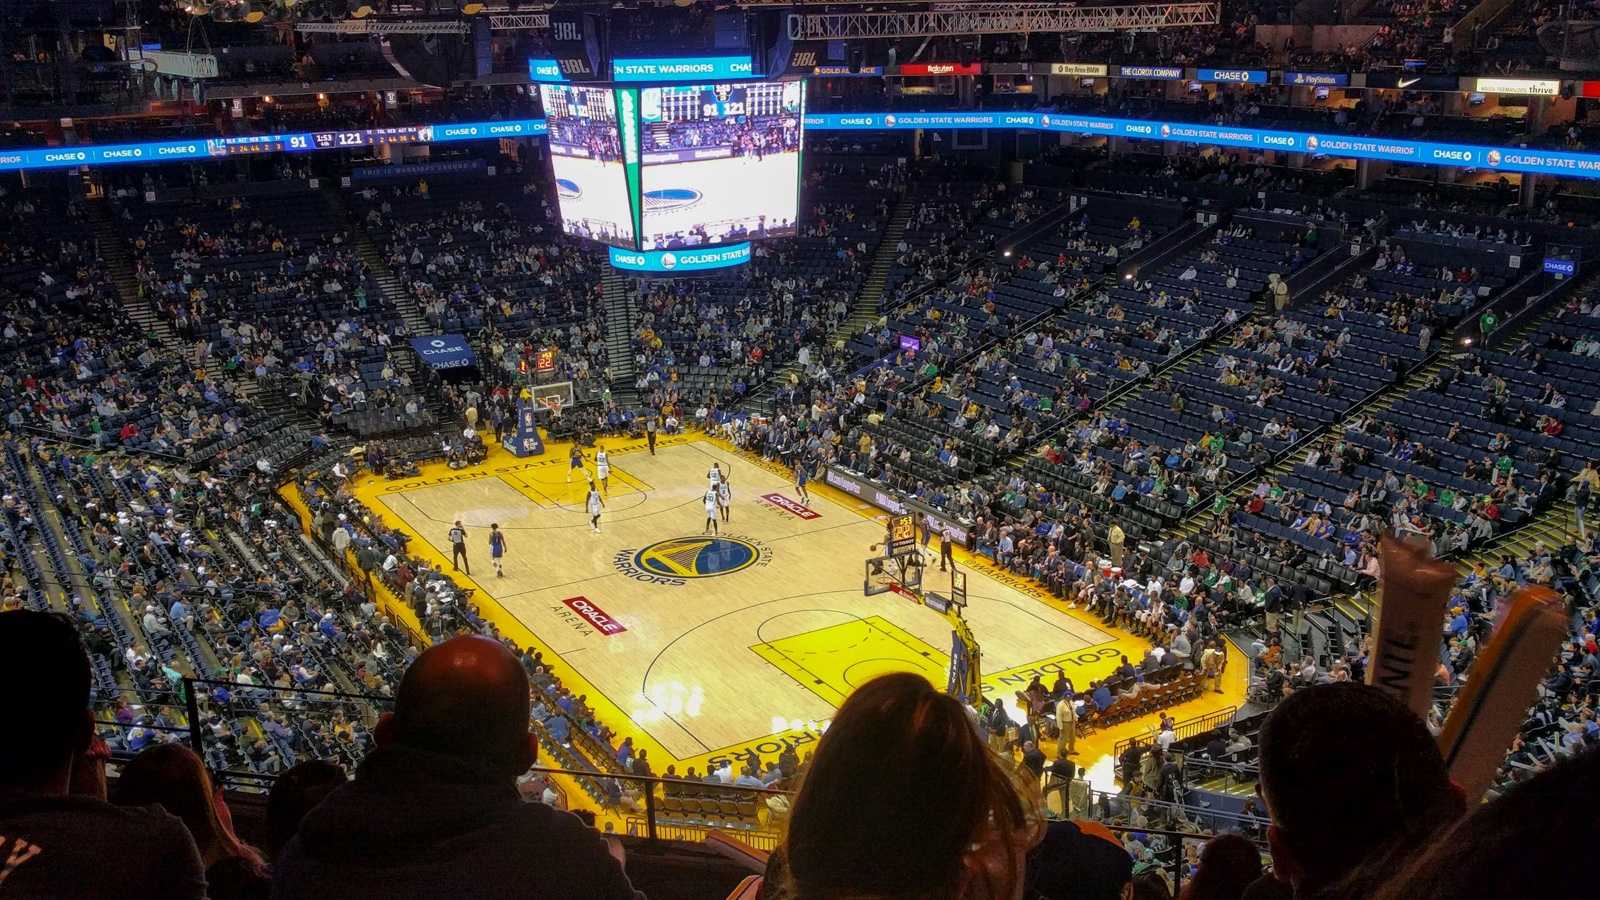
NBA strength of schedule measures how hard a team's opponents are, either as the combined winning percentage of those opponents or as rating points above or below an average slate. The two scales are not interchangeable, and neither one counts rest or travel by itself, which is where a good share of a schedule's cost sits. For a season win total, the useful question is how many points per game a schedule gap is worth and how many games it still applies to.
How an NBA strength of schedule number is built
Every version starts from the same input: a list of opponents and a rating for each one. What changes is the rating.
Tankathon's remaining schedule strength takes a team's remaining games and calculates the combined winning percentage of those opponents. Basketball-Reference works in points instead, and in its glossary definition of SOS a positive number indicates a harder than average schedule. ESPN's Basketball Power Index folds the schedule into the team rating itself: BPI factors in opponent strength, so a win over a strong team is not counted the same as a win over a weak one.
| Measure | Built from | Scale | How to read it |
|---|---|---|---|
| Tankathon remaining SOS | Combined winning percentage of remaining opponents | Win percentage | Higher means the opponents have won more |
| Basketball-Reference SOS | Opponent ratings | Points above or below average | Positive means harder than average |
| Basketball-Reference SRS | Average point differential plus SOS | Points | A team rating already adjusted for schedule |
| ESPN BPI | Team strength, opponent strength, travel | Rating points | Schedule is built into the team number |
Basketball-Reference's Simple Rating System blends point differential and schedule, which is why a team with a modest margin against a hard slate can rate above a team with a bigger margin against a soft one.
Win percentage or rating points: which scale to use
Use a points scale when the goal is pricing. A win-percentage figure treats a one-possession loss and a blowout the same, and it inherits whatever luck sits in each opponent's record. A points figure keeps the margin, and margins are the unit that spreads, totals and power ratings are quoted in, so a points-based gap can be carried straight into a game-by-game estimate.
The win-percentage version still has a job. It is simple, it is published for every team, and when it disagrees sharply with a points-based number, treat the difference as a method gap before reading it as a schedule gap.
NBA strength of schedule so far versus remaining
The "so far" number describes opponents already played and explains a team's current record. The remaining number describes what is left and is the one that bears on a season-long market.
Early in a season the "so far" figure covers only a handful of games, so a team's record can look stronger or weaker than its rating simply because of who it drew. That is the case for adjusting a team's margin by the schedule it has faced, which is what SRS does, and then applying the remaining schedule to the adjusted rating rather than to the raw record.
Rest and back-to-backs in the 2026-27 schedule
Rest is the schedule input most SOS tables leave out, and the league's own numbers show how much it varies. According to NBA.com, teams average 14.2 back-to-backs in 2026-27, the lowest average since the Emirates NBA Cup was introduced, and no team plays more than 16 of them.
The size of a rest edge has been estimated before. Prior research cited in a peer-reviewed study of NBA match congestion puts one day of rest at a 1.1-point improvement for the home team and a 1.6-point improvement for the visitor. That figure comes from earlier work the authors reference, not from their own model, so treat it as an order of magnitude. The practical read: a team sitting at the league maximum for back-to-backs carries a small per-game cost that repeats through the season, and a points-based SOS will not show it unless you add it.
Travel miles and the home-court edge
Travel matters mostly through home-court advantage. ESPN's model notes that home-court advantage grows with the visitor's travel, so a long road trip is harder than the opponents' ratings alone suggest.
NBA.com estimates teams travel about 42,500 miles across the 80-game schedule the league released, and the congestion study says most teams log over 40,000 miles in a regular season. The combination that hurts most is a back-to-back with a long flight between the two games, and the league reports that only 59 back-to-backs involve 750-plus miles of travel in 2026-27. When a team's remaining slate holds several of those, its true schedule is tougher than an opponent-only SOS says.
How much a schedule gap should move a win total
A schedule gap moves a win total by its per-game value times the number of games it still covers. Build it in that order:
- Start from a points-based rating for each remaining opponent, not a win-percentage table.
- Then add the home or road adjustment for each game, larger when the visitor travels far.
- Then add a rest adjustment for back-to-backs, using the published research as a rough size rather than a precise one.
- Finally, convert each game's expected margin into a win probability with your own model, then sum across the remaining games.
The result is an expected win count from the schedule alone, which can then be set against the posted number. A small per-game gap applied across most of a season can move that count more than a large gap over a short stretch, which is why the remaining figure matters more than the "so far" one once a few weeks have passed. The same build-up applies on ice, and our NHL strength of schedule explainer shows how it is measured and priced for hockey.
Slate questions
What does a positive NBA strength of schedule number mean?
On a points scale it means the slate is tougher than an average one. Basketball-Reference states this directly in its SOS glossary entry, so a higher positive figure means stronger opponents, not a better team.
How does Tankathon calculate NBA strength of schedule remaining?
It takes the games a team has left and combines the opponents' winning percentage into a single figure. It is a win-percentage scale, so it cannot be compared directly with a points-based SOS.
Does NBA strength of schedule include rest and travel?
The common tables do not. Opponent quality is the only input to Tankathon's figure, so back-to-backs and road mileage have to be added separately, using the league's schedule notes and models such as ESPN's, where travel distance feeds the home edge.
Data and sources
- NBA.com, Numbers and notes to know about 2026-27 NBA schedule, 14 August 2026
- Frontiers in Psychology (via PubMed Central), Influence of Match Congestion on Performances in the National Basketball Association, 19 February 2021
- Basketball-Reference, Basketball-Reference Glossary, undated, accessed October 2026
- Tankathon, NBA Remaining Schedule Strength, undated, accessed October 2026
- ESPN, What is ESPN's NBA Basketball Power Index, undated, accessed October 2026
Full time. 9 sections from Gamble-24 Slate Desk.