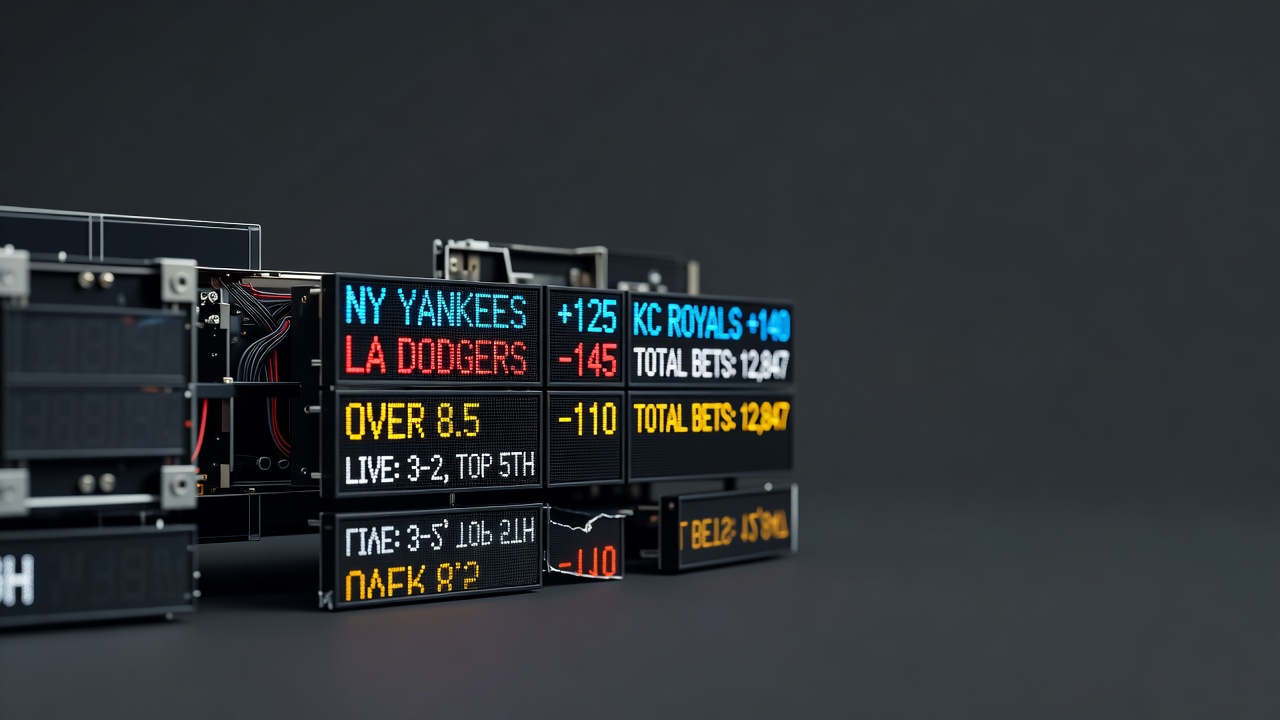
A totals line is an estimate. An NFL game between Kansas City and Denver: the book estimates 45 points combined. They publish it at that number. Why 45? Because their computer models suggest 45 is approximately correct based on team offensive and defensive metrics. Not because 45 is the truth. Because 45 is their best guess.
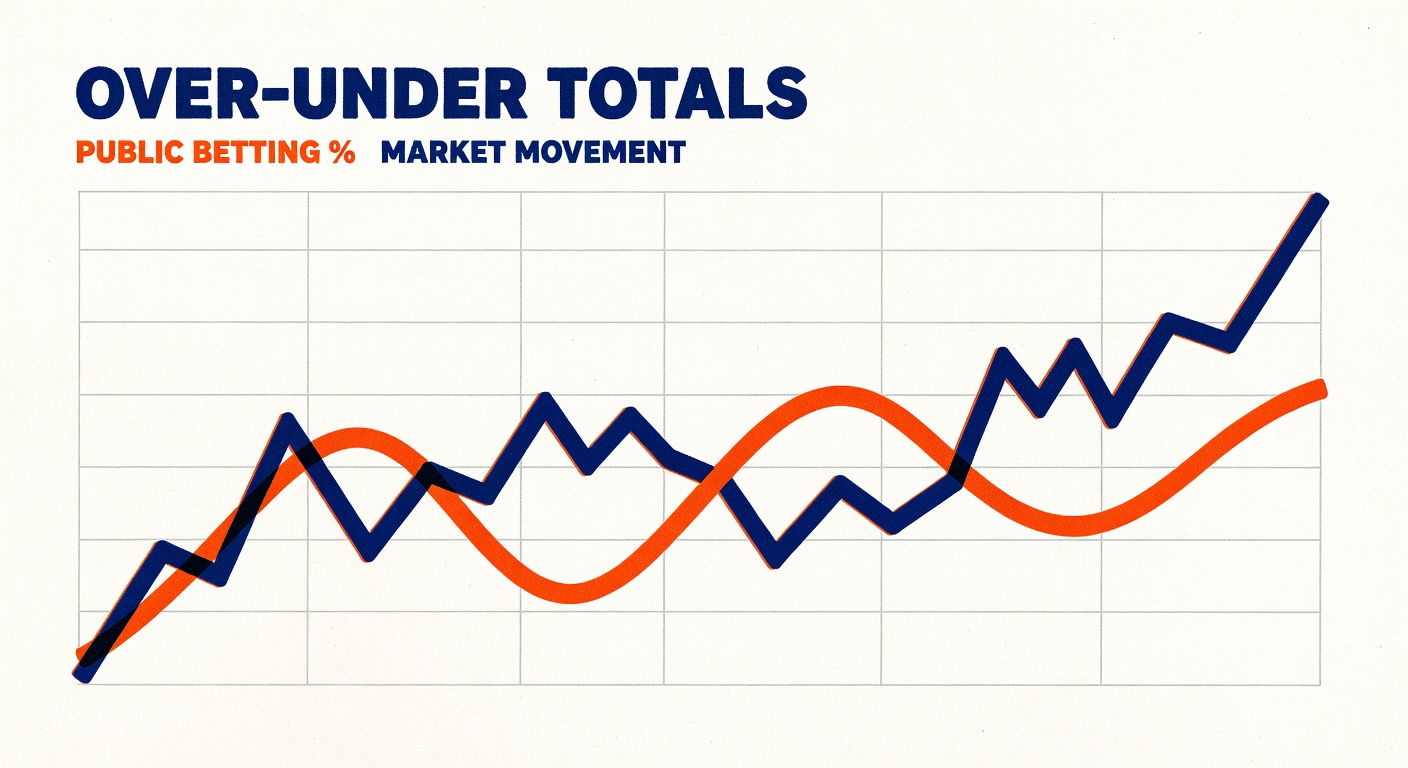
Then money comes in. The public likes the over. Money piles on. The line moves to 45.5, then 46. The book's guess (45) has been revised upward by public opinion (45.5). Is the new number better? Not necessarily. The book moved the line to balance action, not because their model changed.
The Initial Setting
Every major book runs proprietary models for NFL totals. DraftKings uses one model. BetRivers uses another. They're similar but not identical. The differences come from which statistics they weight heavily (some models weight passing efficiency; others weight red-zone conversion rates). A game might be 45.5 at DraftKings and 44.5 at Caesars. That half-point spread is real money.
The model inputs are public: team offensive DVOA (Defense-Adjusted Value Over Average), defensive DVOA, pace of play, weather, rest days, injury reports. You could build a totals model yourself with ESPN data. The books do it better because they have more processing power and more history. But the model is not magic. It's math applied to data.
A game KC at Denver: KC offense is elite (top 5 DVOA). Denver defense is average (15th DVOA). Denver offense is below average (20th DVOA). KC defense is elite (top 8 DVOA). The model weights these. Likely score KC 28, Denver 14, total 42. The book sets 43 or 44 depending on how they weight the uncertainty around injury reports (does KC have their starting tackle or a backup?). The line reflects their best estimate plus a small buffer for juice.
Why Lines Move
Lines move because of two forces: new information and action imbalance. New information: a key player gets ruled out. The model recalculates. If it's a pass-rusher on Denver, the total might drop to 41.5 (more points for KC, more points likely). If it's KC's receiver, it might drop to 42. The book updates.
Action imbalance: the public wants the over at 43. Money piles in. The book doesn't care if they're right or wrong on the over; they care about balanced action. 60 percent of the money is on the over, only 40 on the under. The book moves the line to 44. This attracts under money and repels over money, moving toward balance.
If the line moves and the public is making a mistake, this is an edge. You wait until the line drifts. The opening is usually sharp (close to what the game will actually total). The close is usually sharp (market consensus after 3 days of trading). The middle is often soft (midweek when casual money is light). Early action often drifts the line in the wrong direction because casual money piles on one side without full information.
The Reality of Totals
NFL games are harder to predict than point spreads. The total depends on pace, game script, red-zone efficiency, and luck. A team down 10 in the fourth quarter passes more, plays faster, generates more scoring. Another team up 10 runs the clock, plays slower, generates fewer scores. The script changes totals more than any model can capture.
Why? Because passing is explosive. Three incompletions are 9 seconds. A 40-yard bomb is 6 seconds and potentially 7 points. The variance is immense. A model can estimate average total. It cannot predict whether a game stays close (high total) or becomes a blowout (low total) based on data.
Betting totals, you're essentially saying: "The book's estimate of total points is wrong in a direction I've identified." Most people are wrong. The book employed statisticians. You're looking at the same data. Your edge is timing (catching the line when it's soft) or pattern recognition (noticing that certain matchups consistently go over despite models suggesting under).
The Public's Mistake
The public loves the over. Statistically, over bettors lose slightly to the juice over long periods. Why do they keep betting it? Because over feels like action. Eight touchdowns combined feels more exciting than five. The public is betting entertainment, not expected value. The book knows this. They shade the over slightly worse (-115 rather than -110) and the under slightly better (-105). The book is extracting value from the public's preference for action.
Sharper bettors hunt totals where the public's preference for the over (or under, in quiet games) has created value on the other side. A game where models suggest 48, the opening is 46 (sharp book trying to leech public over money), and the public is piling on the over anyway, creating a line of 46.5. If you think the model is right at 48, the under at 46.5 is a gift. But you're betting against a market consensus that's been validated (the line moved to 46.5 because the public was right and the game looked easy). You're not smarter than the aggregate. You're just contrarian.